A printable growth report showing what happened over the period — and how to read it to make better decisions.
Reporting and Optimization
Overview
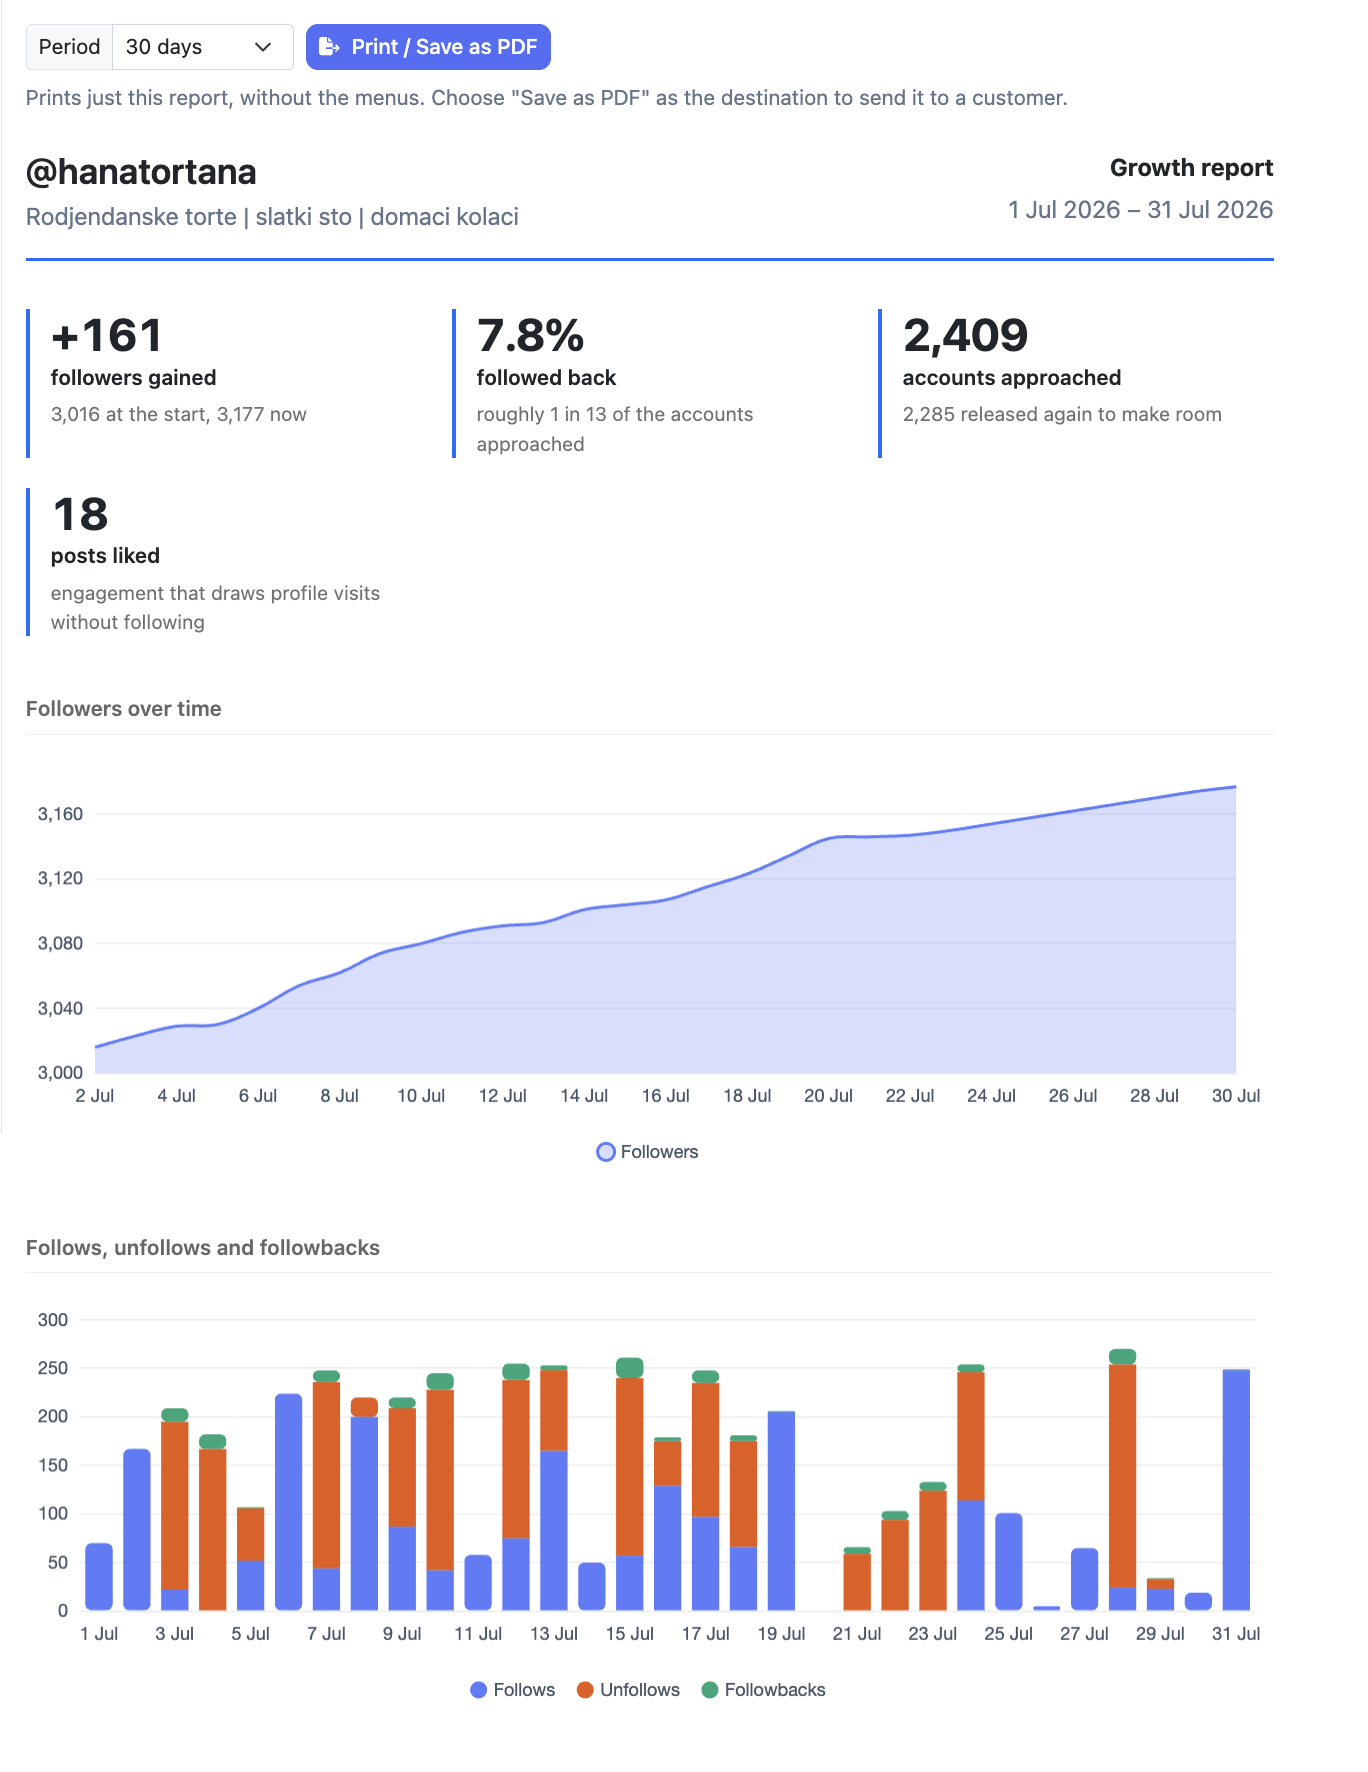
The reporting page produces a growth report for a selected period. It summarizes the key numbers — followers gained, followback rate, accounts approached, source health, and per-source performance — in a single view you can read at a glance or send directly to a client as a PDF.
How it Works
Select a period at the top (default: 30 days). The report updates to show everything that happened in that window.
The report has four sections:
- Key metrics — followers gained (with start and end count), followback rate, total accounts approached, and posts liked.
- Charts — followers over time (absolute count), follows/unfollows/followbacks per day, and likes/welcome DMs per day.
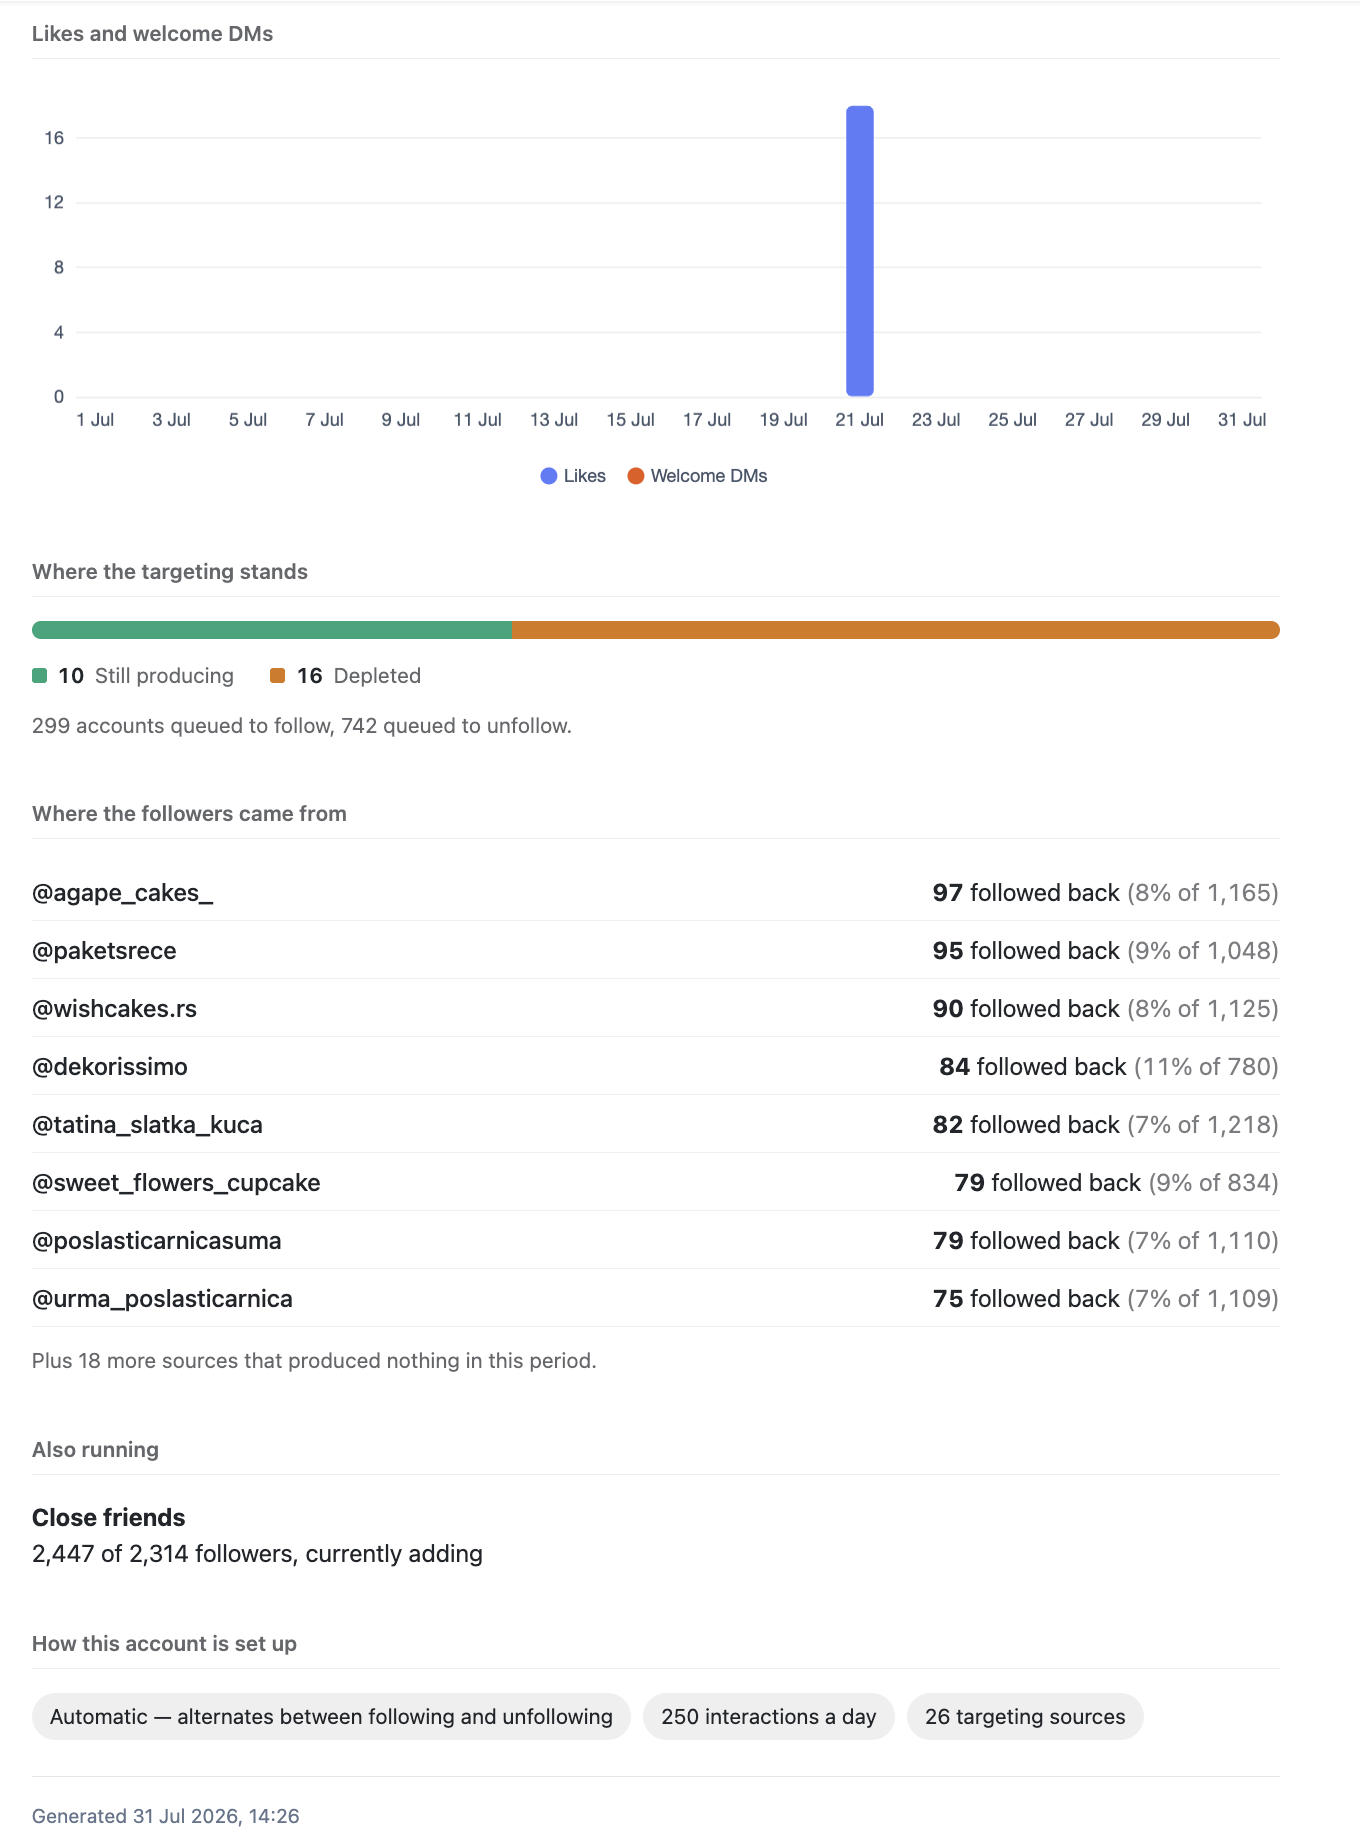
- Targeting summary — how many sources are still producing vs. depleted, and how many accounts are currently queued to follow and unfollow.
- Per-source performance — every source ranked by followbacks produced, with the total approached and conversion rate for each.
At the bottom, the report shows how the account is currently set up — mode, daily interaction limit, and number of active sources.
Growth Report — Overview
Growth Report — Sources & Setup
Sending to Clients
Click Print / Save as PDF at the top of the page. When the print dialog opens, choose "Save as PDF" as the destination. This exports just the report — without any dashboard menus — ready to send to a client.
Using the Report to Optimize
- Low followback rate — check "Where the followers came from." Sources with low conversion rates are likely the problem. Replace them with more niche-specific alternatives and tighten Interaction Filters.
- Many depleted sources — add new sources. The targeting summary bar will shift toward green as they're added.
- Drops in the daily chart — activity dips often correspond to rate limit events. Check Account Overview alerts for those dates.
- Strong metrics but slow follower growth — the daily interaction limit may be conservative. Consider raising it gradually in Dynamics.
FAQ
Can I send this report to a client?
Yes — use Print / Save as PDF at the top. The exported PDF contains only the report, without any dashboard navigation.
What does "accounts approached" mean?
The total accounts Oxelio followed during the period. The sub-label shows how many of those were later unfollowed ("released again to make room").
What does "Still producing / Depleted" mean?
Sources still producing have accounts in them that haven't been followed yet. Depleted sources have been fully worked through and aren't adding new accounts to the queue.
How often does the report update?
Continuously. The period selector includes Today and 24h options for a near-real-time view, in addition to 7-day, 30-day, and 90-day windows.
Troubleshooting
| Issue | Next Step |
|---|---|
| Followback rate is consistently low | Check per-source performance — swap out low-converting sources and tighten filter settings. |
| Most sources show as Depleted | Add new sources. See Sources. |
| Sharp drop in follows on one day | Check Account Overview for rate limit alerts on that date. |