Six interactive charts showing everything the account did — with Instagram challenge events marked directly on the bars so every dip has an explanation.
Analytics
Overview
Analytics shows a detailed, time-bucketed view of everything the account has done over the selected period. All six charts update in real time and are interactive — hover over any bar or point to see the exact value and timestamp for that bucket.
Follows and Unfollows
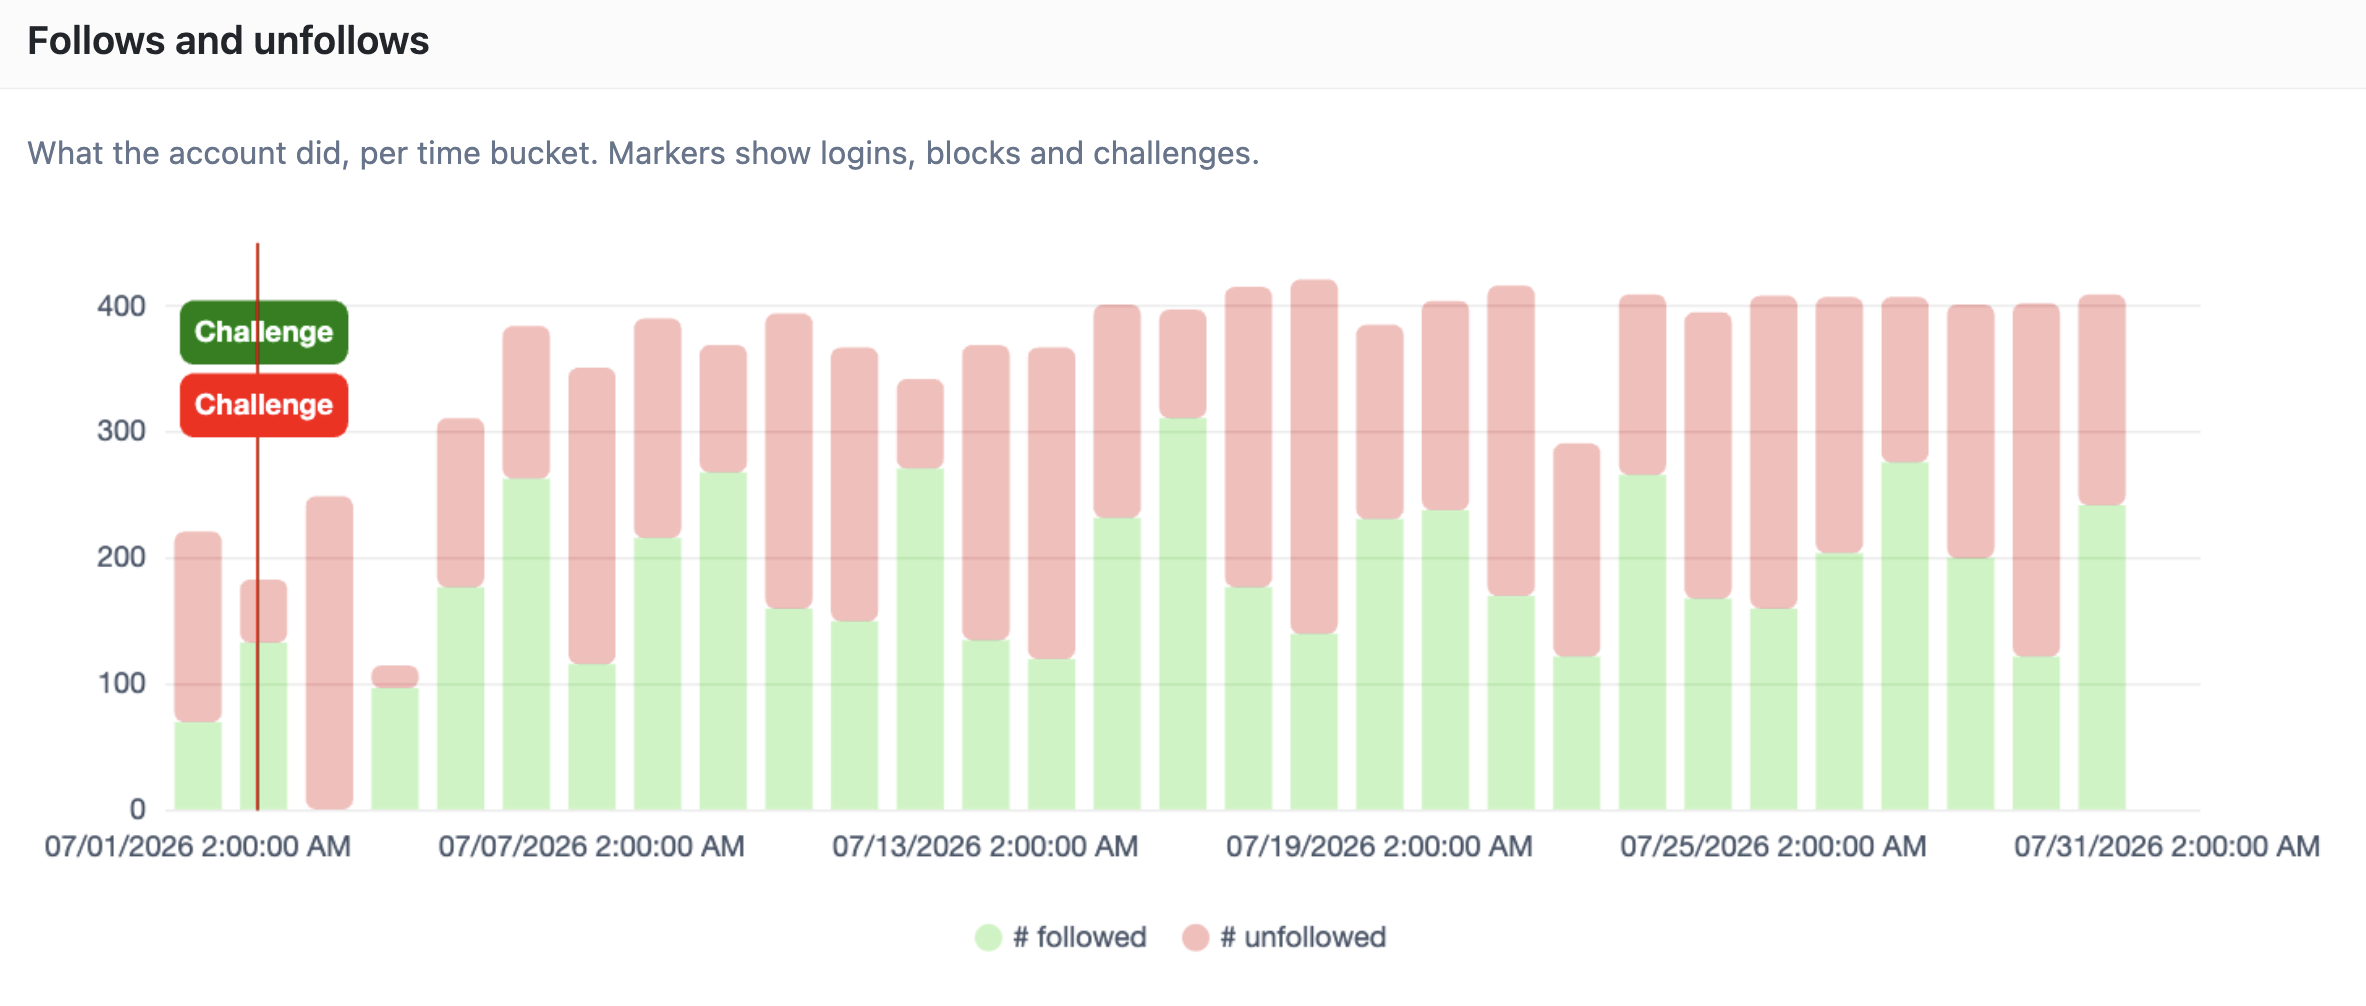
How many accounts were followed (green) and unfollowed (pink) per time bucket. This is where you see the daily rhythm of the automation — and where Challenge markers appear on the chart whenever Instagram issued a challenge to the account. A red marker is the challenge, a green marker is when it was resolved. Activity typically drops during the challenge window and resumes after.
Follows and Unfollows
Followbacks
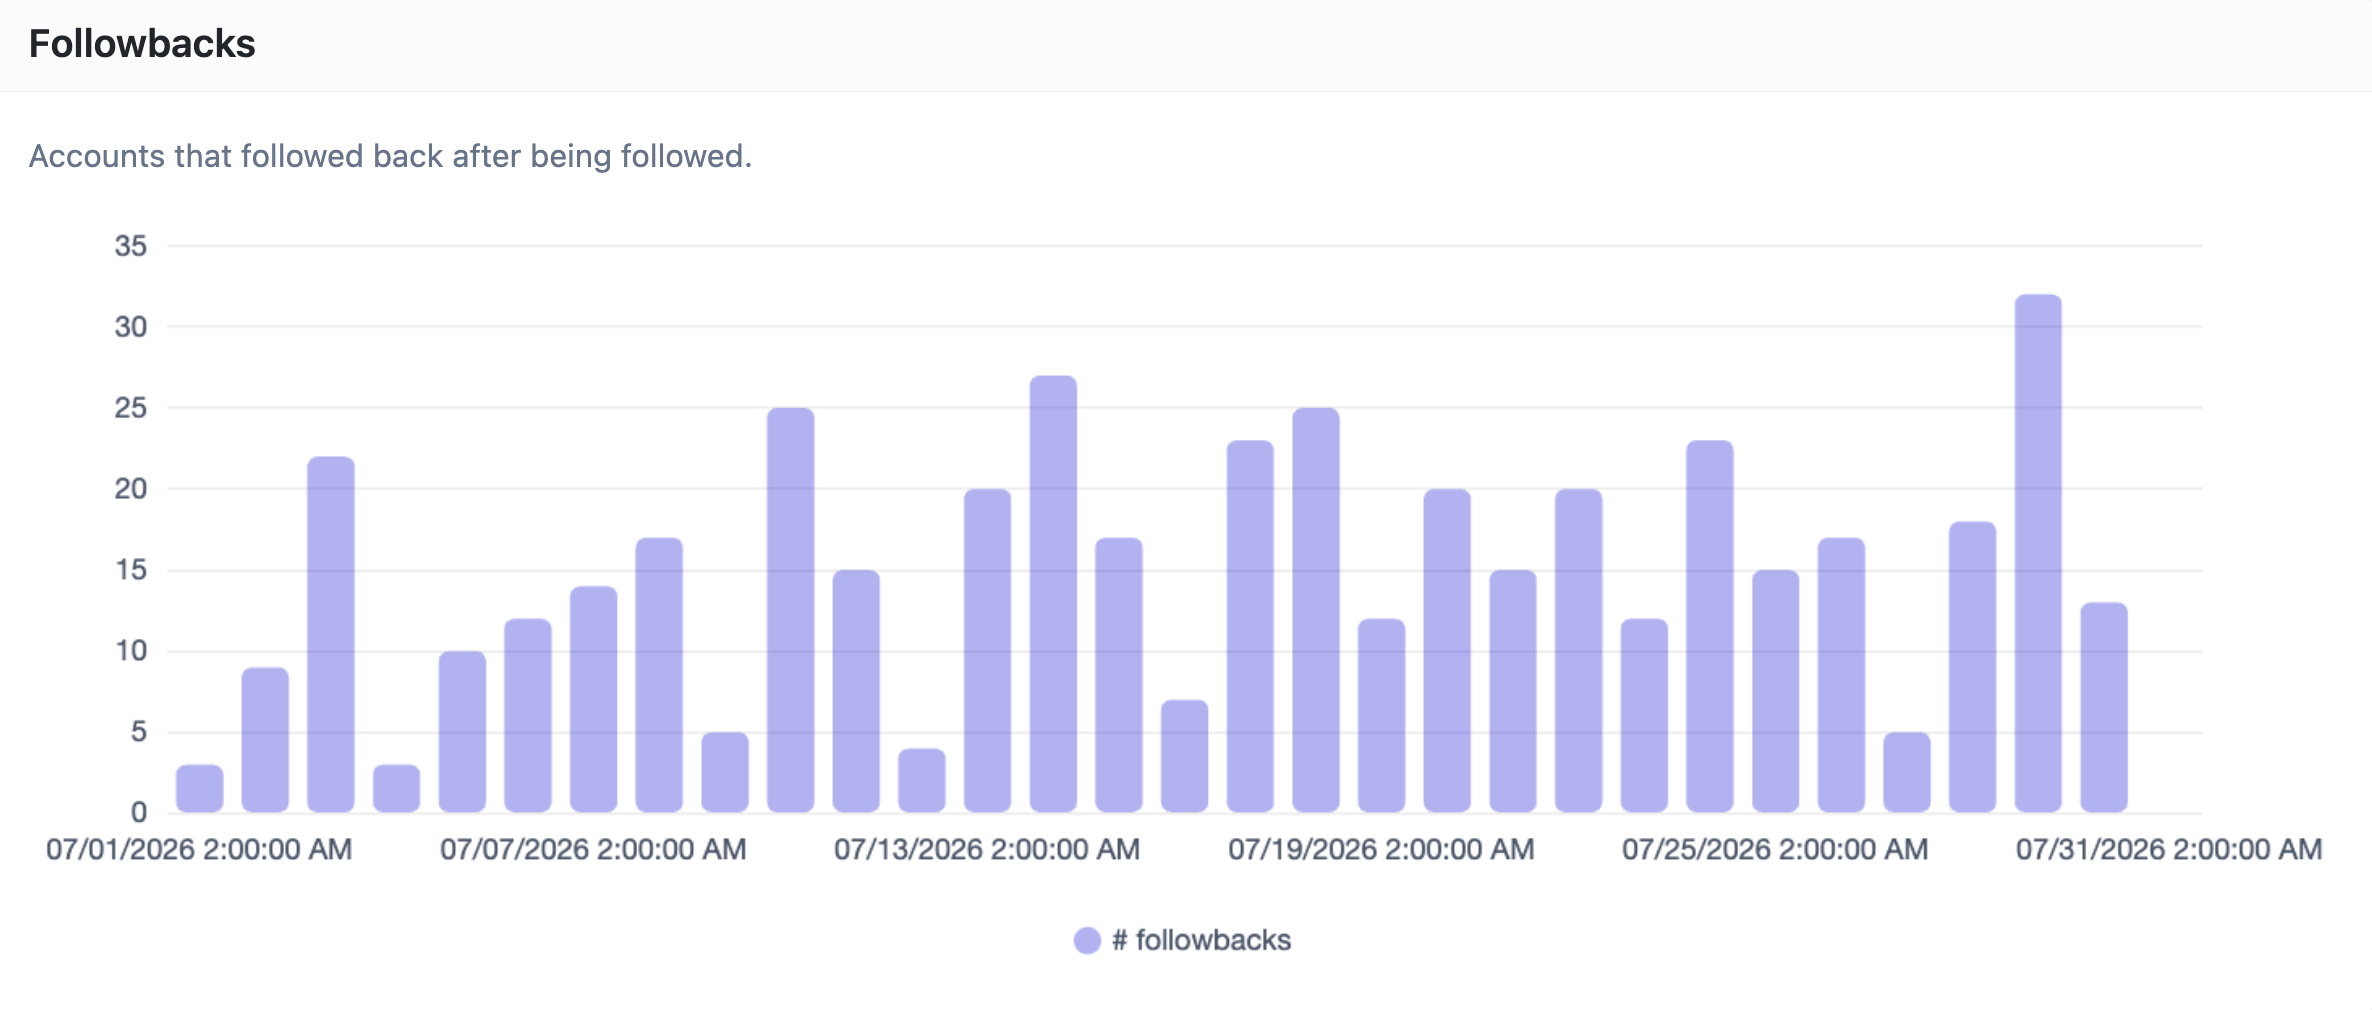
Accounts that followed back after being followed, per time bucket. Compare this against the Follows chart to gauge what percentage of follows are converting. Consistent followback volume means the targeting is working.
Followbacks
Followers
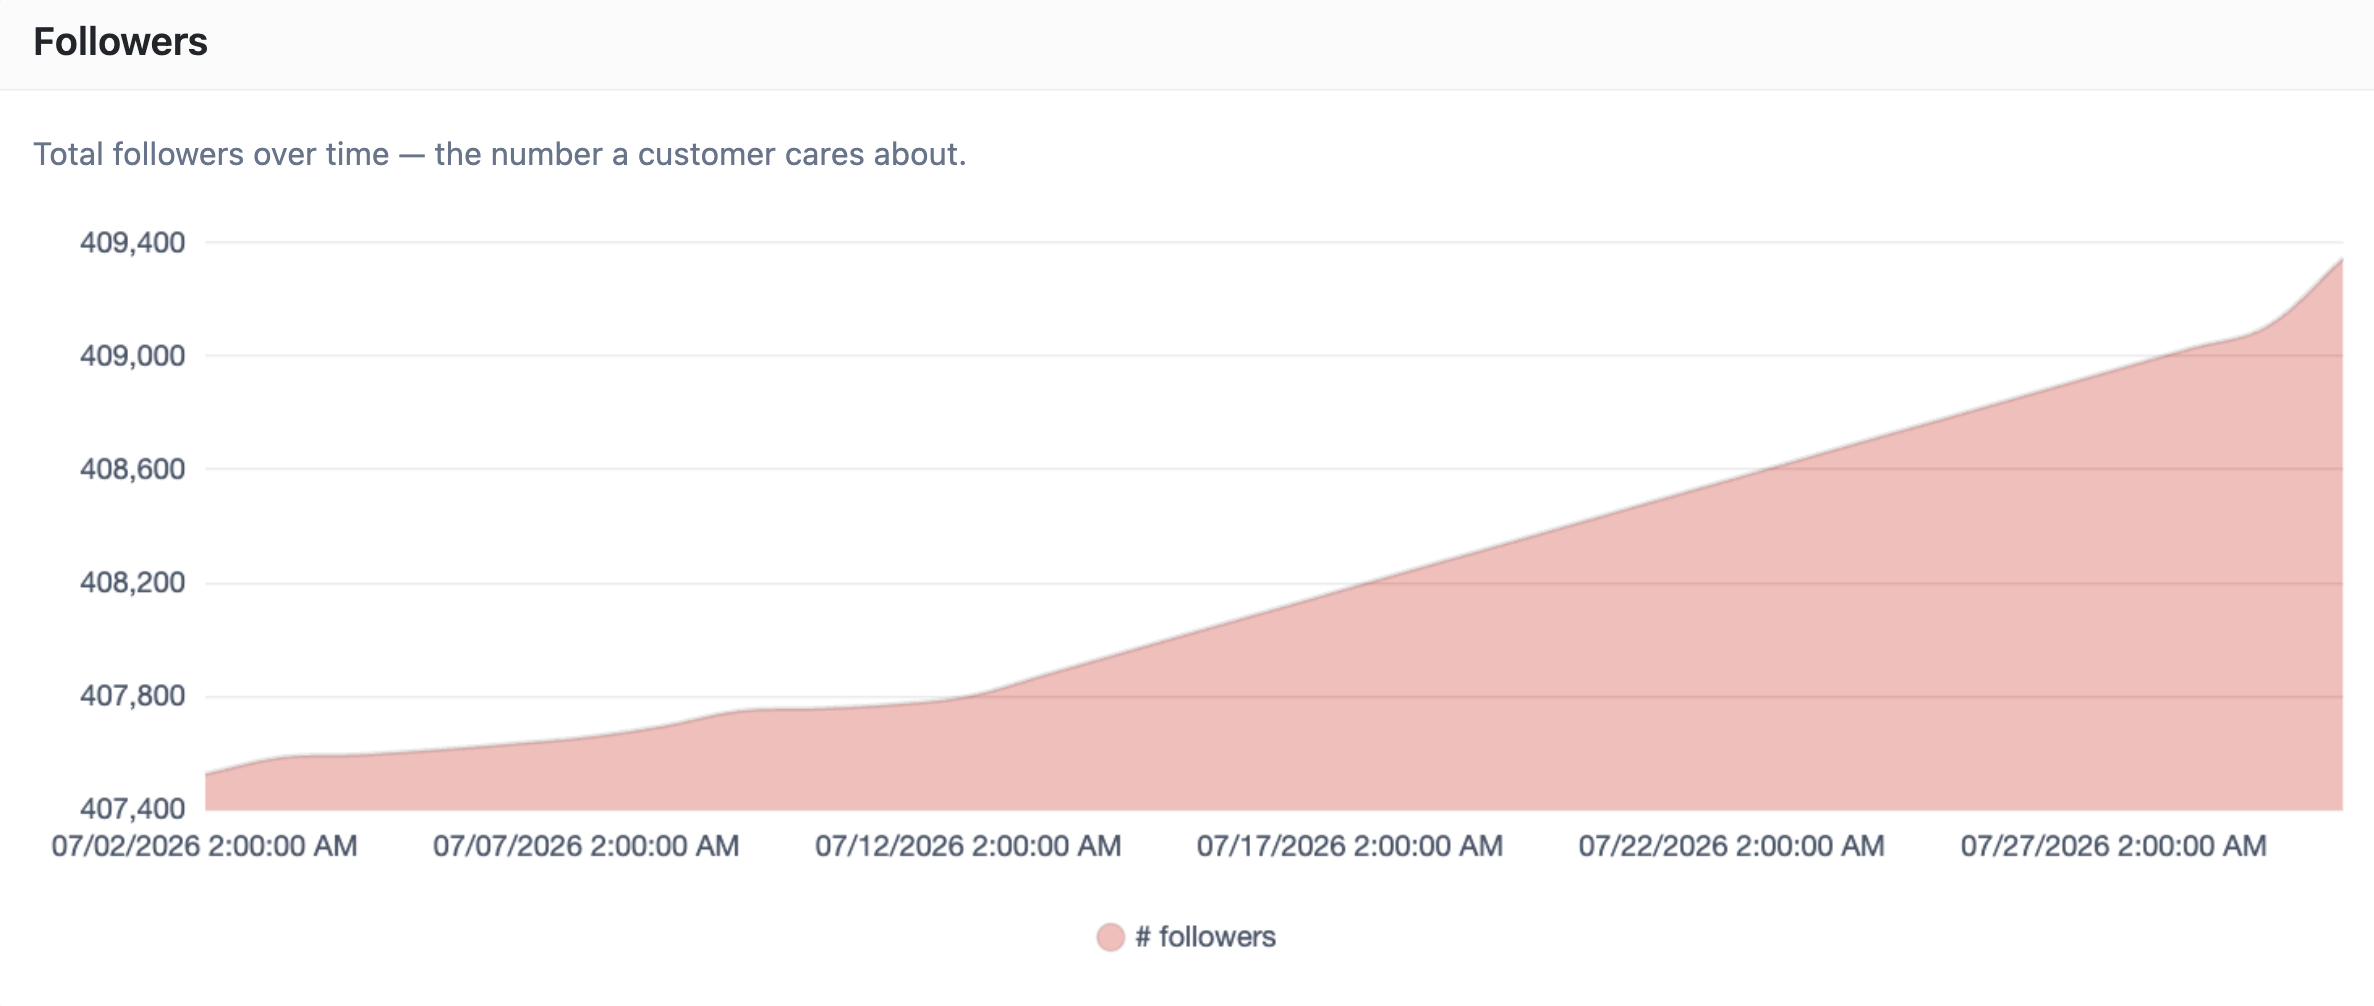
Total follower count over time — the number a client cares about. This is the actual Instagram follower count recorded over the selected period, not a count of Oxelio actions. Hover over any point to see the exact count on that date.
Followers
Following
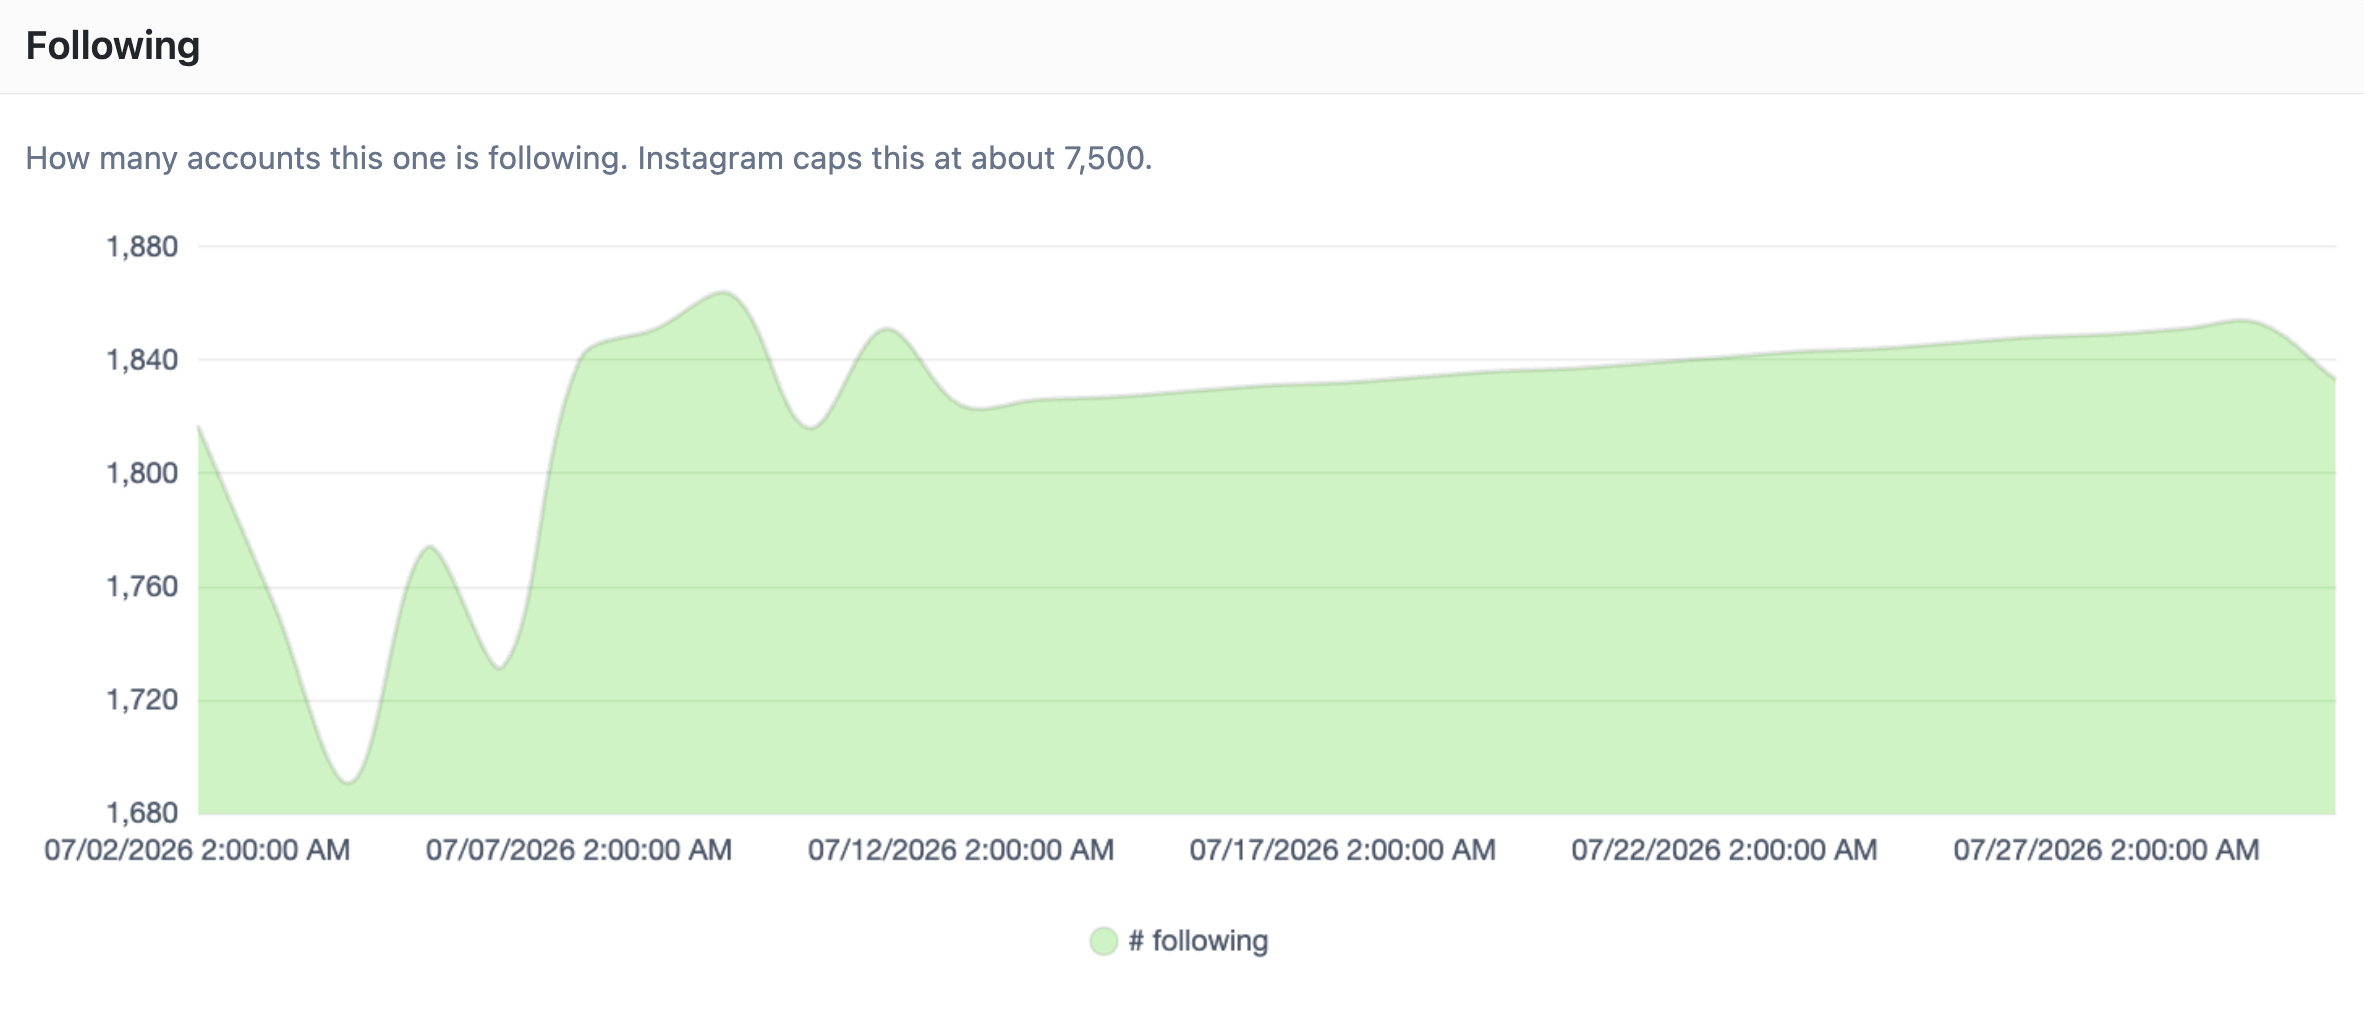
How many accounts the client is currently following at each point in time. The wave pattern reflects the follow/unfollow cycle — the count rises as Oxelio follows, then drops as it unfollows. Instagram caps the following count at around 7,500.
Following
Likes
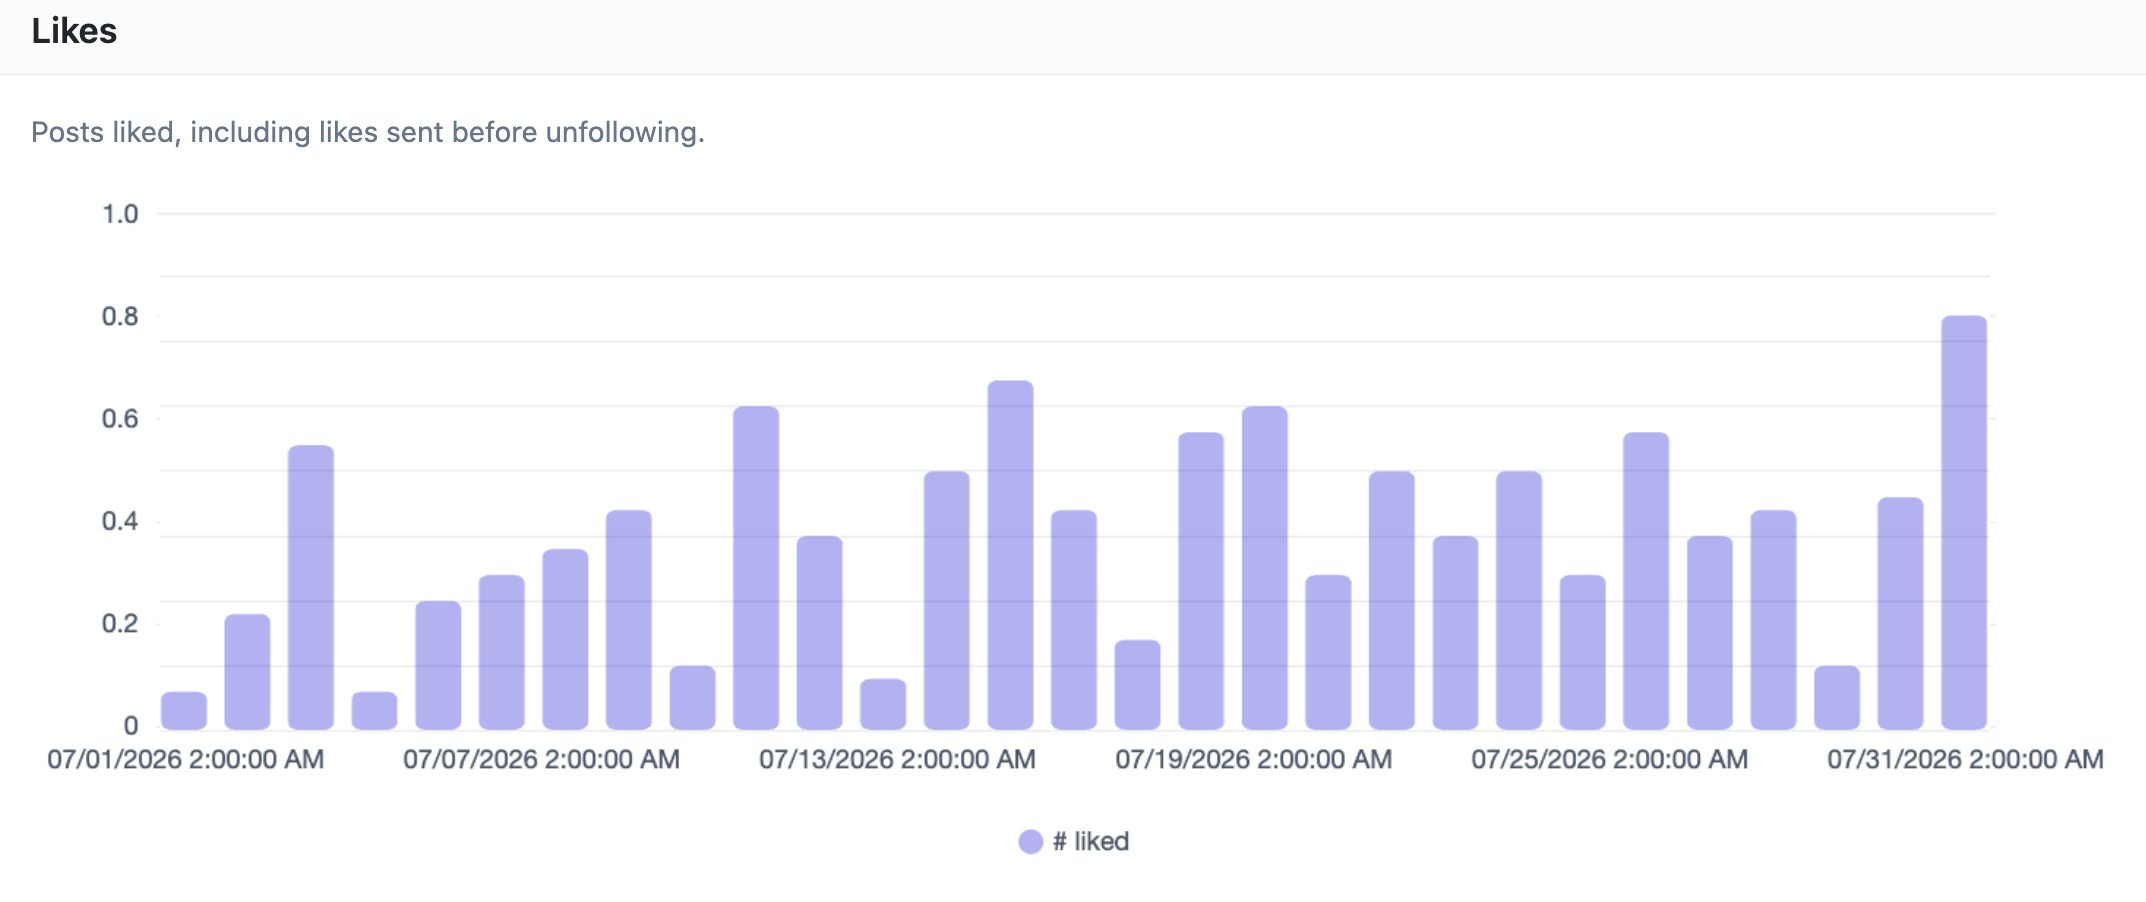
Posts liked per time bucket, including likes sent as part of the Like After Follow flow. This chart only shows activity when the Like After Follow toggle is on — it will be empty if the feature is disabled.
Likes
Welcome DMs
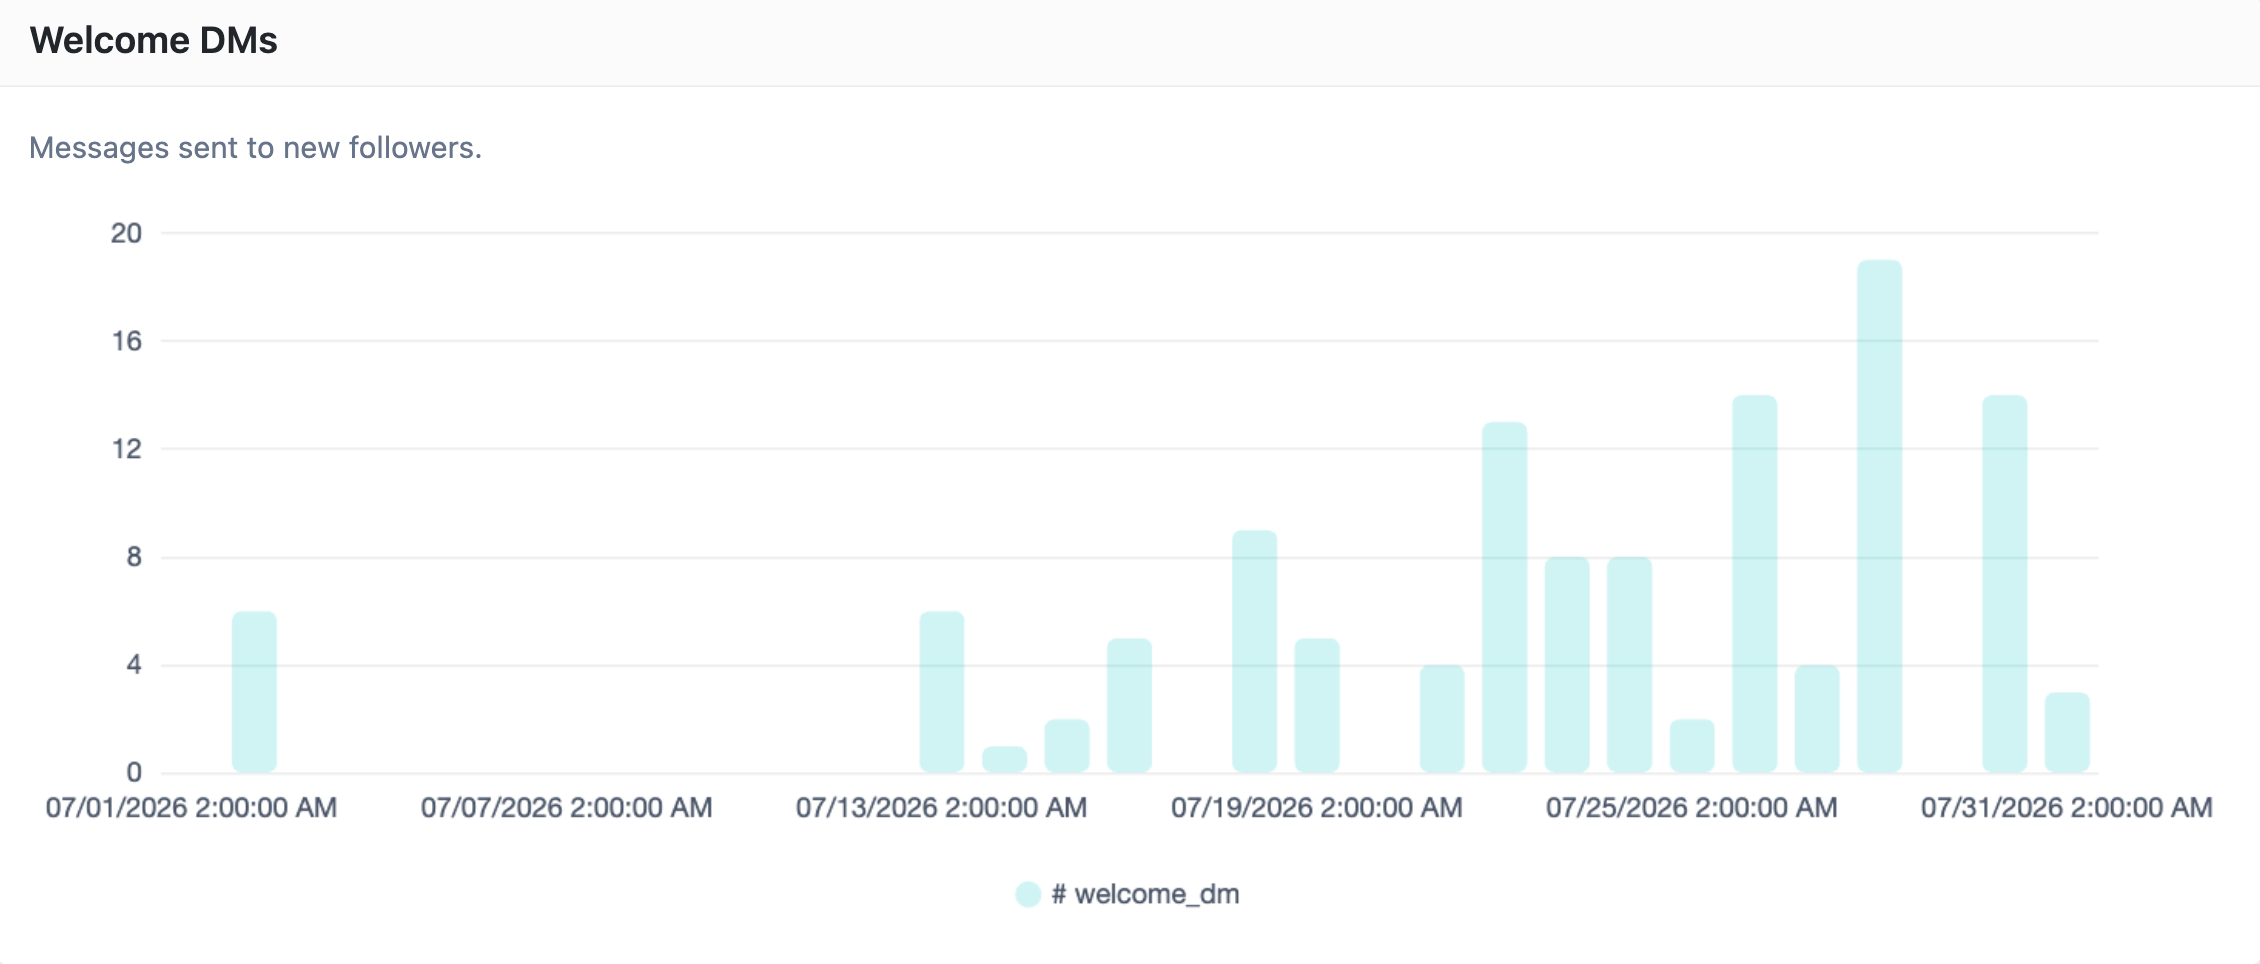
Messages sent to new followers per time bucket. Only active when Welcome DM is enabled and saved. The volume is naturally lower than follows — DMs only go to accounts that followed back.
Welcome DMs
FAQ
Why does the follower count sometimes drop?
A drop can happen when Instagram removes bot accounts from the platform, when the client posts content that causes unfollows, or when Oxelio's unfollow rate temporarily exceeds the followback rate. All are normal.
What are the Challenge markers on the chart?
When Instagram suspects unusual activity, it issues a challenge — typically a CAPTCHA or login verification. A red marker shows when it happened, a green marker shows when it was resolved. Activity pauses during the window and resumes after.
Does Analytics show data before the account was added to Oxelio?
No — only from the date the account was added.
Troubleshooting
| Issue | Next Step |
|---|---|
| Sharp drop in the Follows and unfollows chart | Look for a red Challenge marker at that date — that's the likely cause. A green marker nearby means it was resolved. |
| Follower count flat despite follows being sent | Unfollows are offsetting gains. Check the Follows and unfollows chart — unfollow bars may be outpacing follow bars in that period. |
| Likes or DMs chart is empty | Check that Like After Follow or Welcome DM is enabled and saved in the account settings. |
| Charts show no data | Account was added very recently — data appears after the first activity is recorded. |